Fig. 5
From: From trash to treasure: detecting unexpected contamination in unmapped NGS data
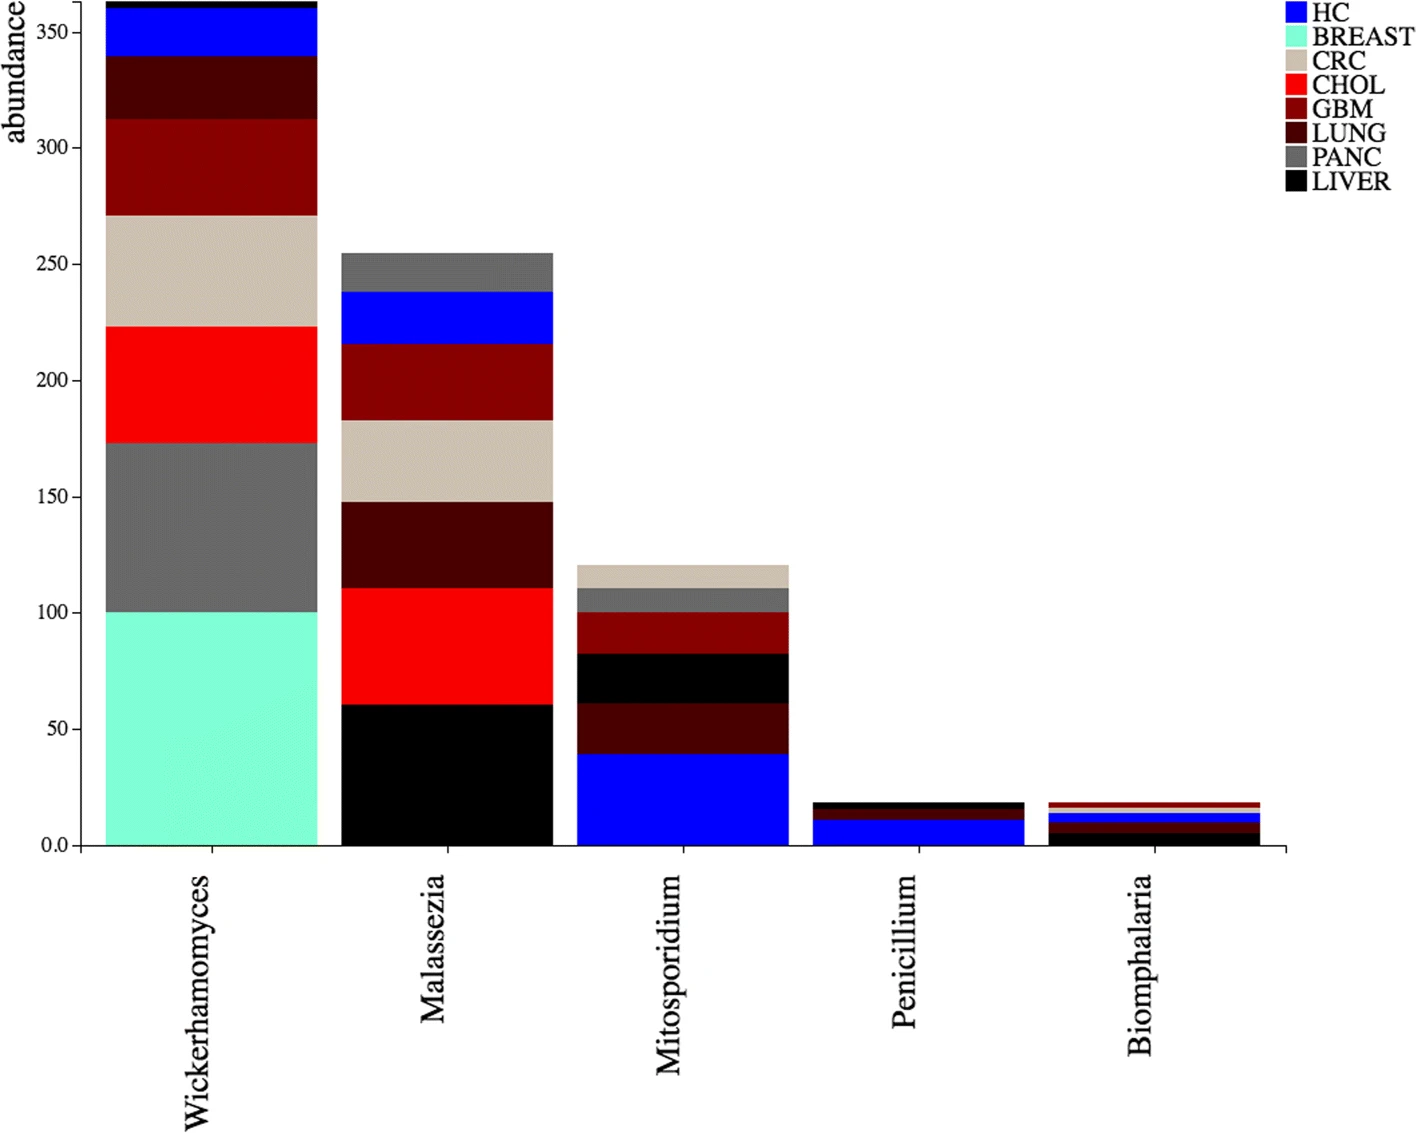
Fungi contamination in tumor and healthy groups. The stacked bar chart shows the fungal genera having an average value in all groups ≥ 10%, considering tumor and healthy (HC) groups. Bars are stacked by the group for which the contaminating organism (x-axis) has been detected. The y-axis scale reports the sum of the values in all the samples. Groups are ranked in a increasing order, in terms of contaminant abundance, from the bottom to the top. The stacked bar charts are automatically generated by the DecontaMiner online companion website