Figure 3
From: VennDiagram: a package for the generation of highly-customizable Venn and Euler diagrams in R
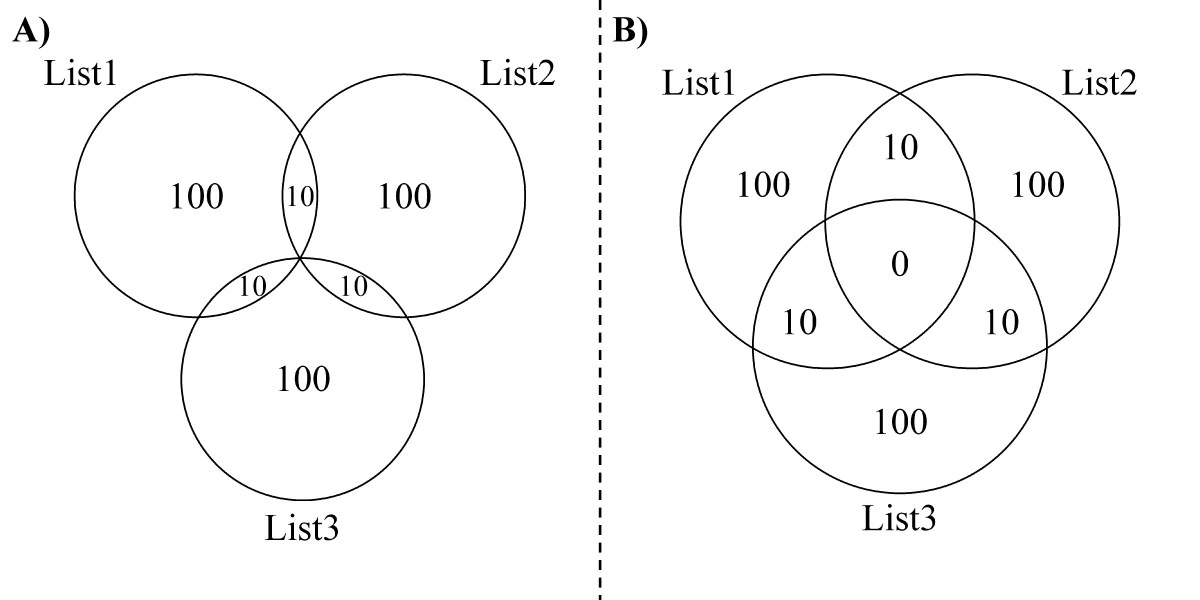
A side-by-side comparison of an Euler diagram and a Venn diagram for the same hypothetical sets. A) The Euler diagram shows only non-zero areas and can therefore be more graphically accurate. B) The Venn diagram shows the non-existent area as an area with zero content. Though this is not graphically accurate, it preserves the recognisability of a Venn diagram.